
Analytics
Session Insights vs Traditional Analytics: What Builders Actually Need
· 6 min read
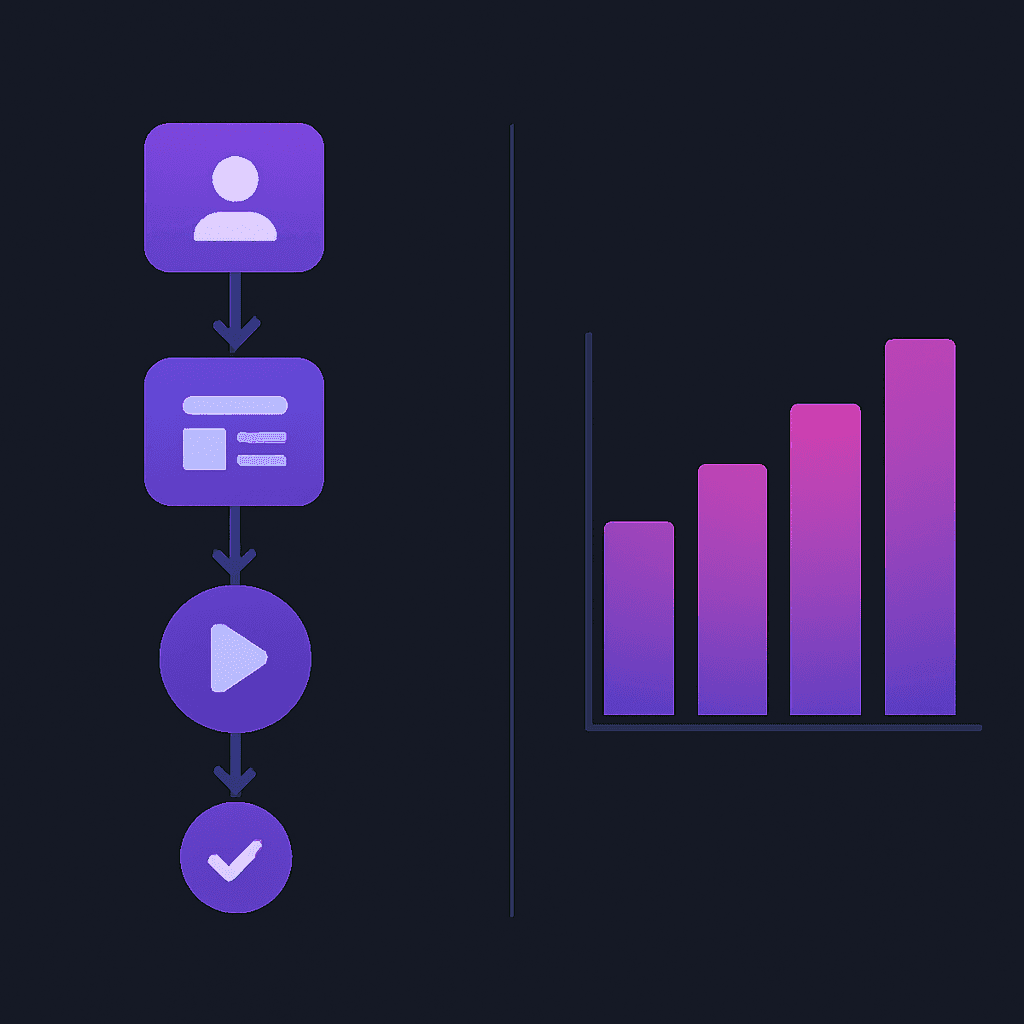
Pageviews and bounce rates do not tell you why users leave. Here is what behavioral data reveals that traditional analytics misses.
If you have Google Analytics installed, you know your traffic numbers. You know your bounce rate, your average session duration, and which pages get the most visits. What you probably do not know is why users leave, where they get stuck, or which UI elements they click repeatedly in frustration.
That gap — between knowing that users left and knowing why — is where most solo founders and small product teams lose weeks of work.
What traditional analytics measures
Traditional analytics tools like Google Analytics, Plausible, and Fathom are built around traffic and content metrics. They answer questions like:
- How many people visited this page?
- Where did users come from?
- How long did they stay?
- Which pages have the highest exit rate?
These metrics are useful for marketing and SEO decisions. They are much less useful for product decisions, because they tell you what happened at the page level without revealing anything about what happened at the interaction level.
What behavioral data measures
Session Insights in Frantiko captures behavioral signals at the interaction level through the first-party Frantiko tracking snippet:
- Rage clicks — the same element clicked 3+ times rapidly, indicating frustration with an unresponsive or broken UI element
- Dead clicks — clicks on non-interactive elements, indicating a confusion about what is clickable
- Drop-offs — the exact point in a flow where users abandon the session
- Feature adoption — which features users actually interact with after first login
- Session replays — full recordings of individual user sessions for qualitative debugging
A concrete example
Imagine your signup page has a 70% drop-off rate. Traditional analytics tells you that 70% of users leave. Behavioral data tells you that 43% of those users clicked the "Continue" button twice before leaving — which means the button is not responding correctly, or users do not realize it has been triggered.
That is an actionable diagnosis. Traditional analytics gives you a number. Behavioral data gives you a fix.
What builders actually need
For a solo founder or small team, the right analytics stack is not either/or. You need both layers:
- Traffic analytics (Plausible, GA4, or similar) for marketing visibility
- Behavioral analytics (Frantiko Session Insights via first-party snippet) for product decisions
The Frantiko tracking snippet installs in under 5 minutes. Once installed, Session Insights automatically surfaces the top behavioral signals from your product — no configuration required.
Try Frantiko for free
AI Architect, Session Insights, AI Fix Center, and Product Reports — all in one place.
Get started free