
Product
The Five Product Health Metrics Every Solo Founder Should Track
· 7 min read
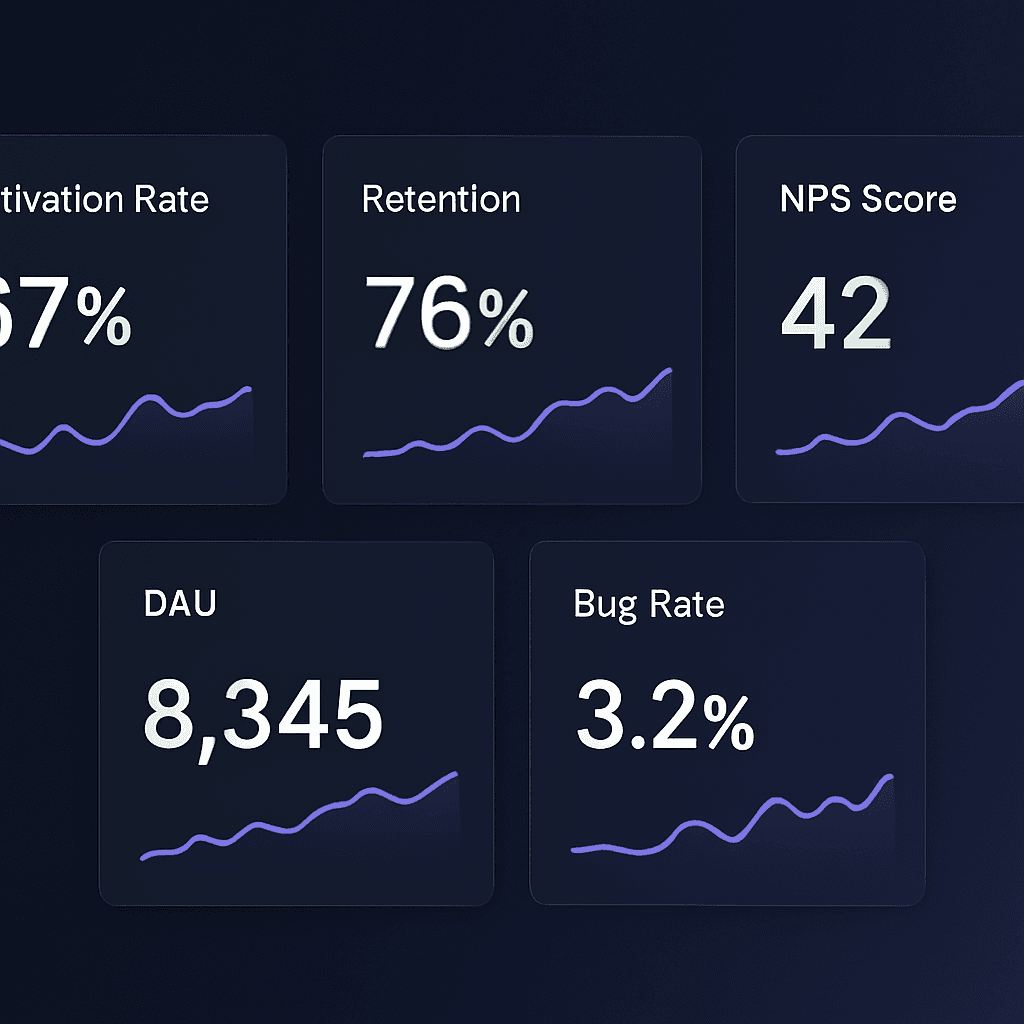
You do not need a data team. These five metrics — measurable in Frantiko in minutes — tell you everything about your product health.
Most solo founders either track too many metrics (and act on none of them) or track too few (and miss critical problems until they become user churn). The right number is five — one metric per dimension of product health.
The five metrics
1. Activation rate
The percentage of signed-up users who complete your "aha moment" — the first meaningful action that delivers value. For a blueprint tool, this might be "created first blueprint." For a SaaS with a core feature, it is the first time that feature is used successfully.
A low activation rate (under 40%) means users are signing up but not reaching value. This is almost always a UX problem, not a product-market fit problem.
2. Day-7 retention
The percentage of users who return to your product 7 days after first use. This is the single most predictive metric for long-term retention. If your day-7 retention is under 20%, you have a core product value problem. If it is over 40%, you have a strong signal of product-market fit.
3. Feature adoption rate
For each core feature, what percentage of active users have used it at least once? Low feature adoption is one of the clearest signals that users do not know a feature exists — which is a discoverability problem, not a feature quality problem.
4. Bug occurrence rate
The number of distinct errors per 100 sessions. Track this in AI Fix Center. A rising bug rate before a fix release is expected. A rising bug rate with no new releases is a signal that something is degrading in your infrastructure or a third-party integration.
5. Support request rate
The number of support messages per 100 active users. A high support rate is usually a documentation problem or a UX clarity problem — not a product problem. Track it weekly to catch regressions after each release.
How to measure these in Frantiko
Product Reports in Frantiko calculates a composite health score from these five dimensions automatically, using data from the Frantiko tracking snippet for behavioral metrics and your DB for product event counts. Run a report at the end of each week to see your score, a trend line, and AI-generated recommendations for the two highest-priority improvements.
You do not need a data team or a BI tool to track product health. You need five numbers and a consistent cadence. Frantiko Product Reports gives you both.
Try Frantiko for free
AI Architect, Session Insights, AI Fix Center, and Product Reports — all in one place.
Get started free